In the spring of 2003 the Charles River and other river cleanups in Massachusetts focused on the presence of non-returnable (non-redeemable) beverage containers retrieved during the cleanup. The hypothesis was that the number of non-returnables (bottled water, juice, "sports" drinks, etc.) would significantly exceed the number of returnable (deposit) containers collected (because the lack of a deposit on the non-redeemable containers would make people much more likely to not dispose of them properly). If this were true, then it would bolster the argument that the state Bottle Deposit Law should be expanded (as Governor Romney proposed in his FY04 budget) to cover these other drink containers, which make up an increasingly larger share of the beverage market.
At the Charles River Cleanup, beverage containers were sorted out of a random sample of trash bags that were returned by cleanup volunteers to the Hatch Shell and to the MDC's Ice Rink in Nonantum.
Here's what we found:
Number of non-returnable beverage containers: 431 (81.78%)
Number of returnable (deposit) containers: 96 (18.22%)
Total number of beverage containers retrieved in the sample: 527 (100%)
In other words, non-returnable (non-deposit) beverage containers exceeded the number of redeemable (deposit) beverage containers by a 4.5 to 1 ratio.
As dramatic as this evidence is, it actually understates the actual disparity between the deposit and non-deposit containers littering the landscape because the latter (despite their increasing market share) still make up much less than 50% of the actual beverage containers sold (more about this below).
Here are some photos of what we found:
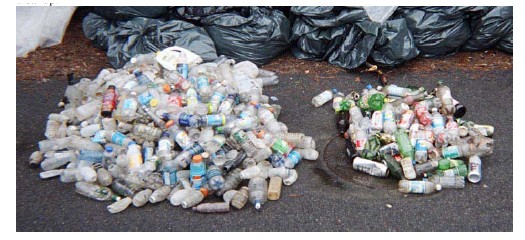
- A comparison of the pile of non-returnable (no deposit) beverage containers (on the left) vs. deposit bottles/cans (on the right) retrieved from a sampling of trash bags collected during the cleanup:
- Another view of the same two piles, with Anna Eleria of the Charles River Watershed Association and myself in the background:

- A close-up of the non-returnable beverage container pile, showing more detail of the types of containers found (varieties of bottled water, juice, "sports" drinks, ice teas, etc.)

Our cleanup findings are even more dramatic when the respective market shares for deposit and non-deposit containers are factored in. According to Peter Allison at DEP, the current (2000 data) market share in Mass. for nonalcoholic beverage containers is 69.56% carbonated (Coke, Pepsi, etc., covered by the current Mass. "Bottle Bill" law) and 30.44% non-carbonated (bottled water, juice, sports drink, etc., not covered by the current bottle deposit law). In other words, about two nonalcoholic deposit bottles/cans are sold in this state for every one non-deposit container sold. (The deposit vs. non-deposit market share difference is even greater for alcoholic beverages, about 10:1.)
If this market share statistic is factored in to the results of our cleanup tally, our findings are even more striking. You will recall that non-deposit containers made up 81.78 % of the beverage containers collected, whereas deposit containers made up only 18.22 % of the total, an approximately 4.5:1 ratio. Factoring in the market share data, it means that although non-deposit containers make up only about 30% of the beverage market, they made up over 80% of the beverage containers found in the cleanup. In contrast, although deposit containers make up at least 70% of the beverage market, they only made up less than 20% of the bottles/cans found in the cleanup. Put another way, as there is currently at least two deposit beverage containers sold in Massachusetts for every one non-deposit container, according to our cleanup tally it is about nine times more likely that a non-deposit beverage container sold in Massachusetts will end up littering our waterways than will a deposit container .
In conclusion, the beverage container tally conducted at the 4/12/03 Charles River cleanup provides ample evidence of the value of placing a deposit on beverage containers in discouraging their improper disposal. It makes a strong argument in favor of expanding the state bottle deposit law to cover bottled water, juice, "sports" drinks and the like so that people see value in redeeming their empties, or, at the least, placing them in recycling bins, instead of littering the landscape with them.
Russ Cohen
Rivers Advocate
Mass. Riverways Programs
Mass. Department of Fisheries, Wildlife and Environmental Law Enforcement